8.4.1 Quantitative dimension of the benchmark
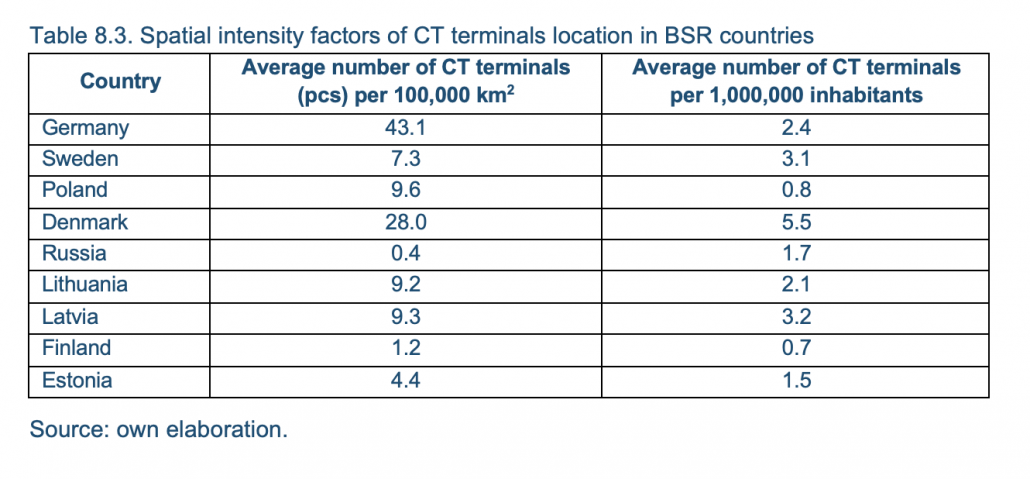
These connections are important parts of the land and sea transport corridors connecting the Scandinavian countries with Central and South Europe, as well as part of the network of transport links connecting northwestern European countries with Central and southeastern Europe. The analysis shows that terminals are an integral part of large logistics centers. They are located on the outskirts of large cities, at a considerable distance from residential areas. Access to transport infrastructure is a priority. The largest number of CT terminals are located in Germany (51), Sweden (32), and Poland (30). The smallest number of CT terminals are located in Estonia (2), Finland (4), Latvia (6), and Lithuania (6). CT terminals are mainly located close to international traffic routes. This has meant that land terminals are mostly located within the TEN-T corridors and near large agglomerations (i.e., at the crossroads of major roads, for example Kutno-A2 and A1 motorway). CT terminals located outside the TEN-T network are located on national trade routes. The preferred solution is to locate the terminals at the intersection of the urban road ring road with the main railway line. In port cities, a large part of the turnover of terminals is made up of sea transport loads, hence their location is as close as possible to the port area. Port terminals are most often served by lines connecting Baltic ports (e.g., Gdynia-Karlskrona, Helsinki-Tallinn, Lubek-Malmo, Rostock-Hamina / Kotka, etc.) and are located in the largest Baltic seaports, thus having a close correlation with other port cargo turnover. The analysis also shows that large urban agglomerations have several terminals—logistics centers or a network of sub-centers located closer to the final recipients of goods (Table 8.3). The average number of CT terminals per 1,000,000 inhabitants for the region is 1.0 (with Russia at 0.6), while the average number of CT terminals (units) region-wide per 100,000 km2 is 8.59 (with Russia at 0.08).
8.4.2 Benchmark of operational and ownership aspects
The operation of CT terminals results from the ownership structure of the terminal itself as well as the operator company operating the terminal. Both of these issues are not always combined in one, many countries in their legal systems separate ownership and operator functions. The most common sector where such separation occurs is port activity and therefore all terminals located there. It is also less common on land. In this section the ownership and management of terminals is analyzed.
At the outset, it should be explained that the basic issue in this respect is the ownership of the property on which the terminal is located. Depending on the country in question, this may be land owned by the government, regional or local authorities, or private property, or the ownership of a railway company that owns the tracks and associated point facilities. The ownership title also determines who the investor in new terminal investments is and who is obliged to bear the maintenance costs of existing infrastructure. In special cases, however, the investor’s responsibility can be transferred to the operator by placing the land itself at the disposal of the operator, who builds the land according to his own needs on the basis of a contract or lease agreement (usually for a long period of even 25-30 years). There may also be situations in which local or central authorities invest in a finished terminal and entrust the operation to private entities on the basis of a bidding or tender or concession.
The issue of ownership of land and infrastructure elements in the BSR states is extremely difficult to collect, as there are no publicly available real estate databases with their owners, which have simply answered the question of ownership. This issue is the subject of a separate study within the COMBINE project.
The research shows that we cannot speak on the BSR scale of one, exclusive or the most common model of terminal ownership. In the following section this issue is analyzed in detail by country.
The second area of analysis concerns the issue of the operational model of the terminal. This model is only partly due to the adopted ownership model, hence the necessity to separate it. The role of a terminal operator can be played by the following entities: state enterprises, private enterprises and public transport service providers (i.e., rail, road, or sea). Such an operator may also be a combined or intermodal transport operator, which, within the framework of its network of connections, based on public access to line infrastructure, creates its own terminal network (i.e., regardless of whether it owns the land underneath). It can also be a specialized operator which, thanks to its experience, locates its terminals in optimal locations and makes its potential available to all those willing to do so on a public access basis. It is then in the interest of such an operator to spread its offer as widely as possible among all railway undertakings, freight forwarders and intermodal operators. The opposite is the case when an intermodal operator creates a network of terminals exclusively for its own needs without making them available to other entities. In this case, the model adopted is an element of competitive advantage over other operators who do not have the possibility of transshipment in a given terminal, and thus in its nearest region. It is rare for several terminals to be very close to each other.
To sum up this thread, four basic operational models of a terminal can be distinguished:
- Fully in-house,
- Concession,
- Operating contract, and
- Rental agreement for commercial operation.
The above options were adopted in the benchmark analysis for the BSR.
The issue of public availability of terminals is an important element of the whole market, as it shows the extent to which new and independent operators can develop their activities.
Table 8.4. presents the summary results of the correlation analysis between the adopted operational model of the terminal and the extent of terminal availability for public entities.
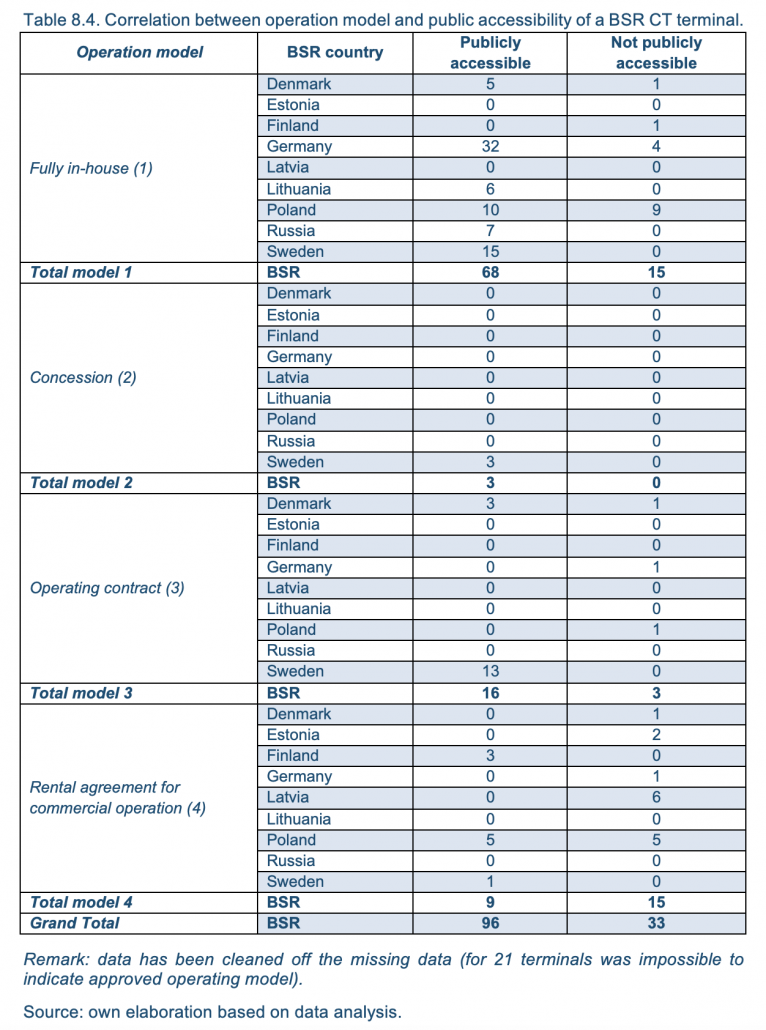
As one can observe, the most popular among the above four models is the model based on the full ownership formula, i.e., a situation in which the terminal operator is also its owner. About 64% of terminals in the BSR have adopted such a model. The vast majority of them operate on the principle of public access (almost 82%). Only 15 terminals managed in this way operate for the exclusive needs of the operator itself. It should be emphasized that this may indicate that the operators still want to maximize the level of utilization of their transshipment capacity by making it available to other entities. It also means that existing terminals are much larger (in terms of turnover capacity) than would be required by the operator himself. The largest number of such publicly accessible terminals are located in Germany (32) and Sweden (15). In Poland, on the other hand, they number 10 which almost equals the number of terminals closed to other operators (9).
The second most popular operator model is rental agreement for commercial operation. This means that the ownership function of the terminal is separated from the operational sphere. In total, there are 24 terminals of this type in the BSR, which constitutes 19% of all analyzed. Interestingly, most of them operate in a closed formula, without public access. This means that if a given operator has undertaken operations on a leased terminal, it is mainly for its own needs. Serving other entities may interfere with their own work and distract them. This is the case in all analyzed terminals in Latvia, which is 100% operating in the presented formula. Also 10 Polish terminals use this model, where the issue of public availability is equally divided into half – half of the terminals offer services for all, the other half do not.
The third most common operating model is the operating contract. It operates on the basis of an order given to an operator selected through a competition or from a free hand. Its task is to provide reloading services for the region or city, i.e., in the public access formula. This is the case in Sweden, where 13 terminals implement this model and in Denmark (four terminals). A total of 19 terminals operate in this way, which is 15 % of all analyzed terminals in the BSR. Of these only three operate in a closed formula, the rest are public. From the accompanying circumstances it can be concluded that such contracts are awarded by municipalities in a situation of market shortages and low interest in this type of activity in a given region i.e., where the volumes of cargo weight do not justify market interest in this industry.
The last operational model, based on a concession, works only in three terminals, which constitutes 2% of the analyzed market. This model is only used in Sweden and takes the form of public access. This applies to two terminals in the port of Gothenburg and one in Gavle. This can be interpreted as a more far-reaching formula than an operating contract to commission specific handling work for a region or city at a specific location on a specific infrastructure. This model, in turn, is more likely to be used in situations where the loading weight of a terminal is so high that many people want to handle it, although only one can physically do so.
To sum up the issue of accessibility, it should be stressed that almost three-fourths of them operate in an open formula. Only 25.6% of the terminals in the BSR are not publicly accessible. Almost half of them (15) operate in Poland while for the remaining countries they are sporadic cases.
8.4.3 Benchmark of operation range
The scope of services offered in the terminal’s CT constitutes the basic area of competitive advantage of each operator. It can be concluded that the primary reason for the location and construction of the terminal is the transport need, which usually results from the vicinity of a large agglomeration or industrial center, or a large seaport. However, as the operational activity develops, the terminal should expand the scope of its service offer, apart from strictly reloading and storage (and of course cargo handling of means of transport). Additional activities may be related:
- a wider range of cargo units (ro-ro, Ro-La, Modalohr, CargoBeamer);
- non-standard loading units and non-standard loads (reefers, dangerous cargo, and oversized cargo);
- new (in relation to the originally operated) modes of transport;
- services on the goods (LCL/FCL formation, packing, picking, packing, etc.);
- services for the shipper and/or forwarder (customs, phytosanitary and customs agency); and
- services to loading units, means of transport and packaging (weighing, repair, servicing, refuelling, certification, etc.).
All the above-mentioned groups of ancillary services are referred to as value-added services and are increasingly common in all types of terminals in the BSR. This often determines the further activity of the terminal especially in case of close proximity to other terminals (e.g., near Poznan/Poland, where we have four terminals located within 60 km radius).
The general conclusions of the conducted analyses allow to determine the typical features that CT terminals in BSRs show and these are:
- 91% of BSR CT terminals are ready to storage of containers and general cargo;
- 77% of BSR CT terminals are ready to storage and handling of reefers;
- 100% of BSR CT terminals are ready to storage of dangerous goods;
- no correlation observed between the service of weighing of wagons/loading units and TEN-T network;
- no correlation observed between the service of weighing of wagons/loading units and RFC;
- correlation between storage of containers / general cargo service and TEN-T network observed;
- none Ro-La units/services in volumes handled in 2018 in BSR CT terminals;
- Ro-La not accepted in Latvia at all;
- no correlation observed between Ro-La acceptance and TEN-T network nor RFC;
- Loading /unloading / transshipment: 100% basic service in Estonia and Latvia; and
- Loading /unloading / transshipment: 100% basic + additional + ancillary service in Lithuania, Finland and Russia.
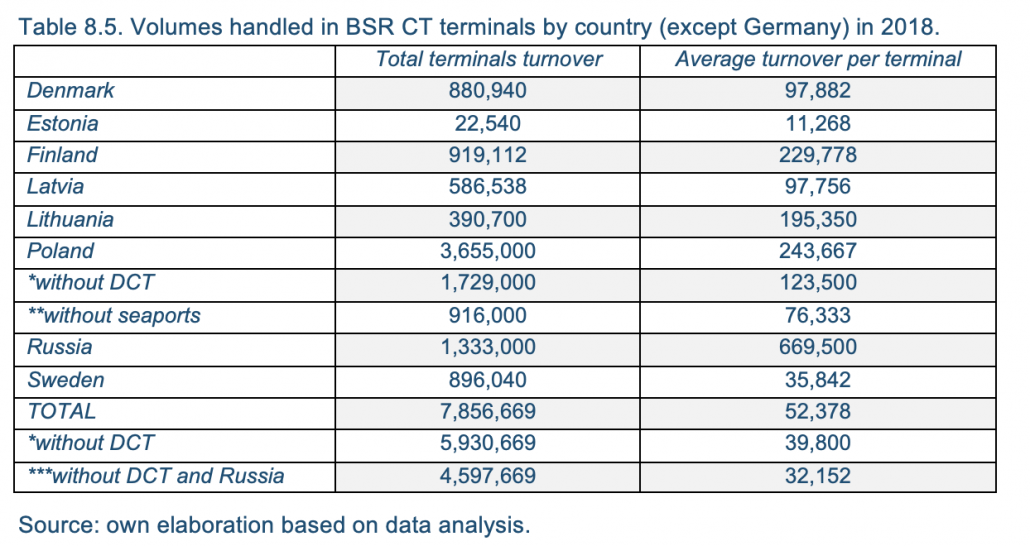
The direct result of the range of services provided is the terminal’s turnover. It can be measured in units of cargo corresponding to 1 TEU, 1 UTI, or in tonnes. The choice of the statistics is up to the terminal operator. However, the biggest problem encountered during the research is the availability of data in any form. It turns out that the operational results of a terminal are usually strictly confidential information covered by trade secrets. Therefore, it was impossible to present and analyze this turnover for the whole BSR. Most of such cases occur in Germany. Full results, in turn, are given by Scandinavian terminals and Baltic States and Russia. Therefore, in the absence of data for some terminals, an estimation method based on data from previous years (rather than 2018) and available transshipment infrastructure and equipment was used. This made it possible to determine the total national turnover and average turnover figures for the terminal by country with the exception of Germany, where the number of unknown turnovers was significantly higher than the number of known results. These are summarized in Table 8.5.
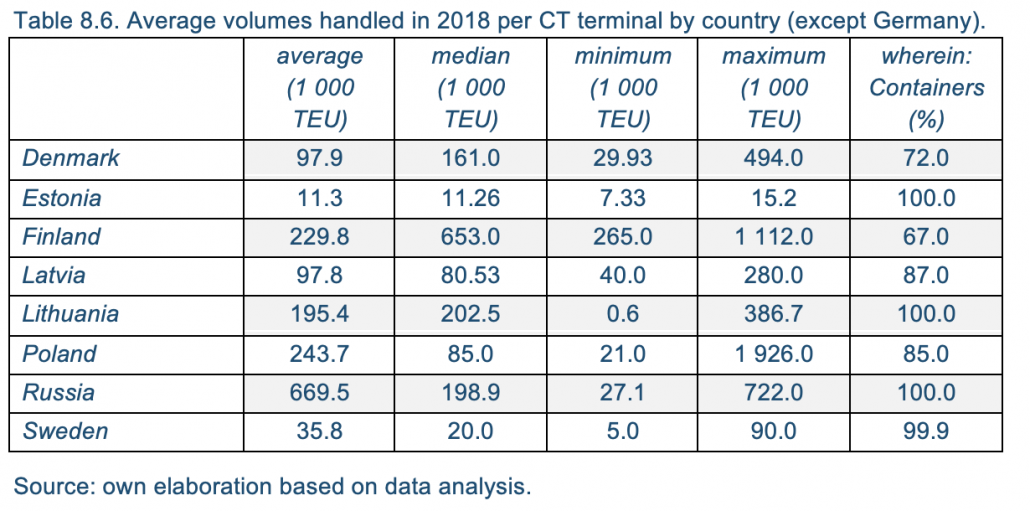
Besides above, based on collected data (Table 8.6) the following general conclusions could be drawn on this basis for the BSR CT terminals:
- total BSR CT terminals yearly turnover exceeds 7,5 million of TEU (equivalent number for all cargo units);
- highest share for Poland, where one terminal – DCT Gdańsk – represents 1.9 million TEU volume a year. The sum of the Polish seaport terminals container turnover exceeds 2.7 million TEU;
- if calculations were to include Russian terminals, which all are located in seaports and service yearly ca. 1.3 million TEU;
- in other BSR countries the volumes handled are influenced by seaports;
- the highest average turnover per terminal is in Russia (669 500 TEU);
- the lowest average turnover per terminal is in Estonia (11 268 TEU);
- an average result per terminal for the whole BSR equals to 52,000 TEU, and when corrected by eliminated DCT high score, the value falls to 39,800 TEU. Further on, corrected by DCT and Russian terminals, the average BSR volume handled is reduced to 32,152 TEU a year; and
- 100% containers at CT terminals (2018) in Lithuania, Estonia, and Russia. In other countries the structure of units serviced includes also trailers and swap bodies, but in a very limited dimension.
8.4.4 Benchmark of infrastructure and transshipment aspects
The spatial location of the terminal is a strategic issue. The operational issue is its reloading capacity. This depends on two basic components of each terminal—infrastructure and reloading equipment (i.e., suprastructure). Both of these elements are crucial for determining the capacity of each terminal. It can be measured both dynamically and statically.
Dynamic measures relate to the rate at which the transshipment of loading units in the terminal is or can be performed, e.g., the number of TEUs trans-shipped per hour, per shift, per month or per year or the maximum number of loading units that can be handled in the terminal within a given time. As such, the first example shows the reloading work performed and the second example shows potential reloading capacity. The difference between the two is important and tells us how much the terminal uses its capacity. The ratio of the first meter to the second is between zero and unity. In this group of meters, you can also find retail indicators that tell you about the speed of operation of individual handling equipment or the acceptable speed of movement within the terminal by different means of transport. However, these are individual meters for each device and for each manufacturer, which makes a more general comparative analysis impossible. Therefore, within the framework of data collection, the number of the main handling equipment has been limited, without going into details about its brand and model.
Static meters speak of the number of loading units that may be present in the terminal at any given time, distinguishing between location and nature. This can be distinguished by the capacity of the storage yards, the storage area, including covered storage, the number of rack stands, parking spaces for trucks, the number of siding tracks and loading tracks.
Next, the results of benchmarking analysis will be presented according to particular parameters: storage area, number of tracks, number of cranes, number of mobile handling equipment and weight limits of handled units as the most important parameters speaking about CT handling capacity of terminals.
Parameters related on terminal area
This parameter determines the one-time amount of cargo units that a terminal is able to absorb at one time. For seaport terminals this is crucial in terms of the capacity to accommodate the largest container vessels (22,000 TEU and more). For inland terminals this is important in terms of the capacity to handle a certain number of trains per shift or day in the knowledge that stripping and forming a train composition requires an average of three to seven days to deposit the cargo unit at the terminal (in some standards it can be 14 days). This parameter may be supplemented by additional information. For example, the number of places for refrigerated containers for which a power supply system is prepared (for the connection of refrigeration units) is additionally given. Under special conditions, this allows for the handling of reefers on long distances (e.g., Italy-Scandinavia, for fruit, vegetables, fish and meat). A lack of mention of such a service in the official data of the terminal, which was met very often during the research, may indicate a lack of such service, although not necessarily. Often terminal operators forget to provide such data, which has been confirmed many times during research. Another type of detail is the information about the covered area of warehouses available in the terminal. This means that not only the forming services of FCL/LCL load units can be performed in the terminal, but also value-added services on the cargo themselves.
Based on the analysis results, it can be determined that:
- the average size of the CT terminal in the BSR is 183,743 m2 (18.4 ha);
- this corresponds to a storage capacity of approximately 7,900 TEU, but in reality, this capacity measured in container slots is much lower;
- this average is overestimated by port terminals, which are approximately 3 to 4 times larger than the land terminals in the BSR;
- the smallest average terminal areas are in Finland, Lithuania and Sweden;
- the highest average terminal areas are in Denmark and Russia (with only seaport terminals analyzed in Russia);
- the average storage area needed for a storage capacity equivalent to 1 TEU is 23.3 m2, with two important correlations: port terminals, despite storing containers in a larger number of layers (which underestimates the consumption rate of m2 per 1 TEU), require more space per balance for the movement of larger cargo handling equipment and thus overestimate this rate, while land terminals, despite their smaller size, make better use of available storage areas for cargo units;
- the average size of a terminal in the BSR is between 50,000 and 70,000 m2, while in TEU units it is 2,000-3,000;
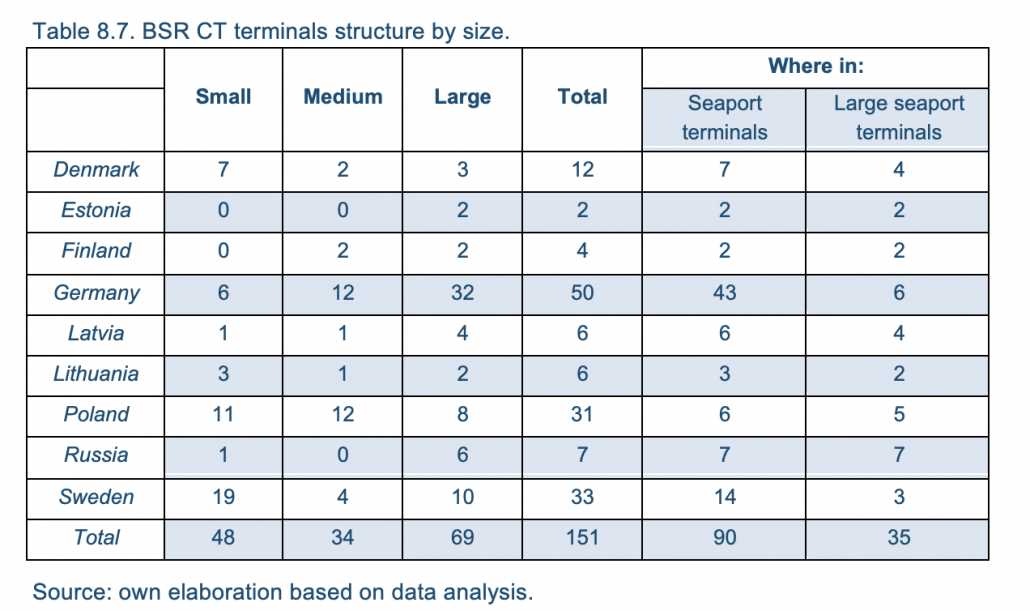
- this average does not reflect the reality well enough and it is necessary to analyze the size of the terminals according to the initial division into three types: small, medium and large (Table 8.7), where small size terminal means area below 40,000 m2, medium size terminal means area between 40,000 and 70,000 m2 and large size terminal means area above 70,000 m2;
- of the three types of terminal size, the most common one is large (69 units), followed by small (48 units) and then medium (34 units); these values include a total of 90 port terminals, including 35 very large port terminals; and
- average values of terminals areas for all BSR terminals are interesting, where only Lithuania terminals oscillate around 50,000 m2 and all other exceeds 100,000 m2 (except Sweden with average area of 93,000 m2).
Parameters related on rail infrastructure
The basic transport mode for inland terminals is rail. It is also crucial for all port terminals with high container turnover in terms of hinterland services. Hence, not only the availability of international terminal rail services (i.e., whether the terminal is part of the TEN-T network and the RFC, as discussed in Section 3.1) is important, but also the number of tracks inside the terminal on which wagon loading can be carried out. This issue is not clear, as there may be tracks inside the terminal for warehouses waiting to be handled, in transit, but mainly for the handling itself, unloading and loading. There may also be tracks for the train marshalling, especially when the length of these tracks within the terminal is less than 400 m, which makes it impossible to place the entire train on a single track, and makes it necessary to disconnect the wagons into two or three groups and dismantle them into two or three tracks respectively, and then, after loading, form them again into one depot. The most common train length limits in Europe are 650-700 m. As practice shows, however, most often the tracks located in the terminal are used first of all for cargo handling, and in addition, they also serve for parking or forming trainsets.
On the basis of analyzed data, BSR CT terminals are characterized by the following features:
- the average number of tracks in one terminal for the whole BSR equals to four;
- the most common number of tracks (dominant feature) is two;
- the average is overstated by large land terminals and port terminals; the highest ratio was recorded in one terminal in the port of Hamburg-14;
- the lowest value of this parameter was recorded for Estonia (2), while the highest for Finland (6), and Russia (5.7);
- high number of rail tracks plays important role for seaport terminals, especially the largest ones, which export to the hinterland up to 35-40% of containers by rail;
- the average small inland terminal is served by two tracks, with a fairly short length of up to 450 m;
- the longest trains are allowed in Sweden—up to 950 m;
- the smallest discrepancies are found in the German terminals, where it is standard to be able to handle freight trains up to 700 m long. Terminals in other countries show very big differences, both spatially and generically and allow handling sets from 300 to 650 m long; and
- an exception in the region is the Kouvola terminal, where it is possible to handle trains up to 1,100 m long – however, this is the result of specialization in handling empty containers from Finland to China, which was until recently the case at this terminal.
Summarized detailed data is shown in the Table 8.7.
Parameters related on transshipment equipment
Equipping the terminals with gantry cranes determines its role in the national and international transport system. At the beginning, however, it is necessary to distinguish very clearly between seaport terminals, where STS (ship-to-shore) gantries are the basis of activity. Their quay outreach and lifting height are proof of the gantry generation. Currently, the most modern ones handle up to 28 containers from the quayside and up to a height of about 73.5 m above the ground. Their capacity is counted in 30-35 operations per hour for single crane trolleys, and it is also possible to operate sets of two or more containers at the same time. However, such types of cranes are not yet available on the Baltic Sea.
The basic equipment of large land terminals is RMG (rail moulded gantry cranes, which cover up to four railway tracks and up to four vehicle lanes. RMGs with a width of 3+3 (3 tracks + 3 lanes for lorries) are standard. Importantly, RMG’s equipment of the terminal demonstrates its high level of infrastructural development, as this type of gantry requires larger areas with a paved surface and is also equipped with mobile cranes (RTG—rubber tyred gantry crane). Therefore, RMG does not meet in small terminals, while in medium-sized ones it is sporadic. They are mainly used in border terminals, especially when there is a change in track width (1435/1520 mm).
From the analysis it can be concluded that:
- in the BSR the average number of gantries per one terminal is 4.4;
- the extreme values of this parameter for individual countries range from 0.3 (in Sweden) to almost 25 (in Russia, but only port terminals were included in the analysis, with the largest ones in St. Petersburg, which significantly disturbs the region’s average);
- in Poland, the average values of the index are overstated by the three largest container terminals, with 56 cranes self in DCT Gdansk. Excluding these three port terminals, this parameter reaches 1.2 with a simultaneous number of 16 terminals in Poland that do not have this type of gantries at all;
- in Sweden, only 9 terminals have any type of gantry at all, with a maximum of two per terminal; similarly, in Denmark, where half of the total number of gantries are STS, the rest are located in five land terminals;
- as many as 61 terminals in the BSR do not have any gantry and are mostly small or medium size CT terminals;
- a typical arrangement for a small inland terminal is one crane or one or two reachstackers instead;
- in inland terminals equipped with gantries, there is an average of 1,000-2,000 TEU of storage capacity per one gantry, with a maximum of 50,000 TEU in extreme cases; and
- port terminals equipped with cranes have an average storage capacity of 3,000-3,500 TEU per crane station, with a maximum of 75,000 TEU (Ventspils) in extreme cases.
Parameters related on mobile equipment
Terminal mobile cranes are used in two ways. First, basic and handling equipment, is especially used in small or medium size terminals, where there are no gantries, or accompanied by one RMG. Mobile cranes are most effective in this type of terminal due to their high flexibility of application, both in terms of the type of units they serve (i.e., universal spreaders make it possible to pick up both containers and craneable trailers or swap bodies) and spatially (i.e., anywhere in the terminal the handling in a truck-truck or trick-train or truck-barge relation). From this point of view, mobile cranes constitute the basis of operational activity. The second way of using them is as complementary devices, mainly for back-up activities or short movements within the terminal. This is the case in large terminals, which are based on the operation of STS or RMG railway gantry cranes and cooperation with RTG’s on storage yards.
Both ways lead to a similar scale of application, as the small terminals require two or three such devices, while the large terminals still support the handling work on the gantries, while the mobile cranes are treated as peripheral or complementary equipment.
The following conclusions can be drawn from the data analysis:
- the average number of mobile cranes in BSR terminals is 3.1;
- this value is very significantly influenced by 440 devices in Germany alone and 100 in Poland; in the other BSR countries the total number of these devices oscillates between 13 and 19; only Estonia shows a total of three such devices;
- the national averages also show large disparities, ranging from 1.3 (Sweden) to 11.9 (Germany); and
- these are mainly reachstackers, less mobile cranes or straddle carrier – these are very rarely used in terminals of universal character or with the lowest infrastructure development threshold.
Parameters related on weight limits for cargo units
From the point of view of accessibility, the terminal is also determined by the maximum permissible weight of the cargo units to be handled. This is important in the case of heavy containers and semi-trailers, especially in relation to imports from China and in the conditions of cross-border transport of heavy units.
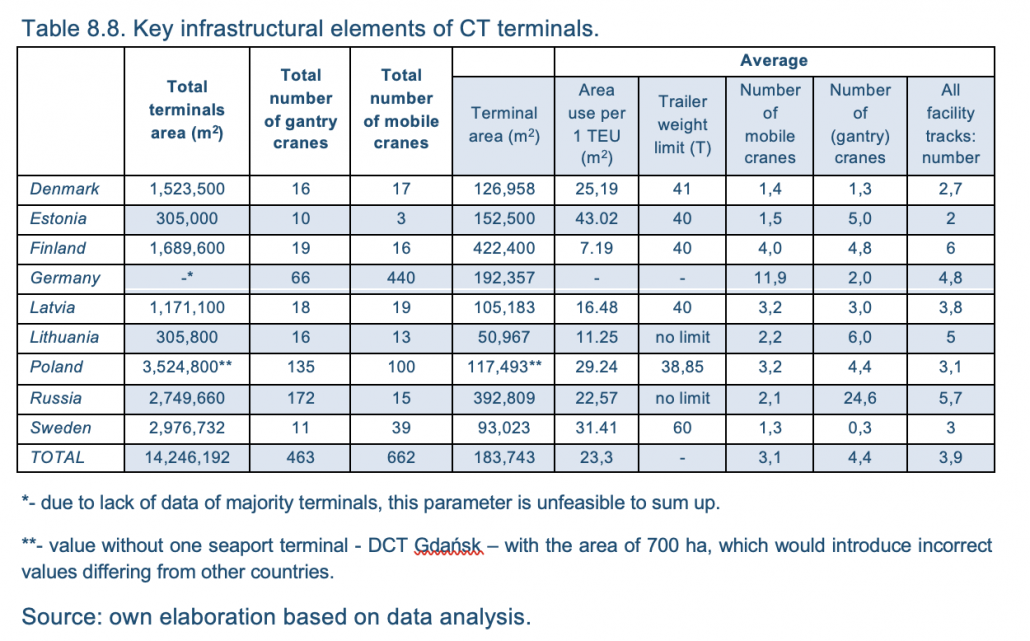
In general, similar standards can be observed in the BSR (Table 8.8), which have their origin in the cooperation within the EU of all countries. This standard is defined by the weight of 40 tonnes per unit of cargo. Of the analyzed countries, only Poland shows a lower value of this parameter (38.85 tonnes on average). On the other hand, there are two countries – Lithuania and Russia, in which there are no such limits at all. Sweden deserves to be mentioned as well, as it allows for a maximum weight of 60 tonnes as standard, and there is a discussion on the introduction of 80 tonnes in road traffic in this country.
As an exception for CT, the permissible increase of the limit to 60 tonnes of a lorry in Germany on certain roads can be regarded as an exception, which also results in increased limits for the units handled at terminals. In the case of the MPs, it is permissible to increase the limit by one tonne provided that the transport is carried out using the last mile technology, which is defined as a section of up to 150 km between the last terminal where the unit left the railway and the destination of the transport.